
A Facebook ads report should answer one question in under a minute: are the ads making us money? Most reports bury that answer under reach, impressions, clicks and pages of charts.
Ours are short on purpose. Here is what goes into every Facebook ads report we send, with a real example.
The 4 numbers every Facebook ads report needs
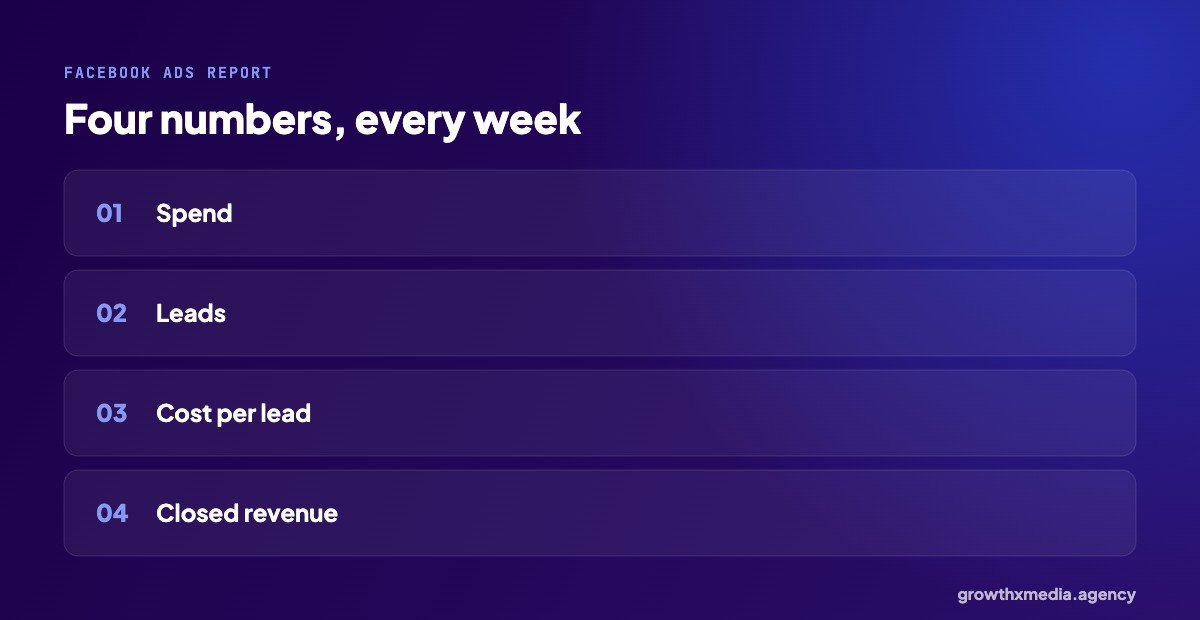
- Spend: what you paid Meta this week.
- Leads: form leads and WhatsApp chats, counted separately.
- Cost per lead: spend ÷ leads, per campaign.
- Closed revenue: what those leads turned into, from your CRM or sales sheet.
If you need help with the third one, see how to calculate cost per lead.
A real example
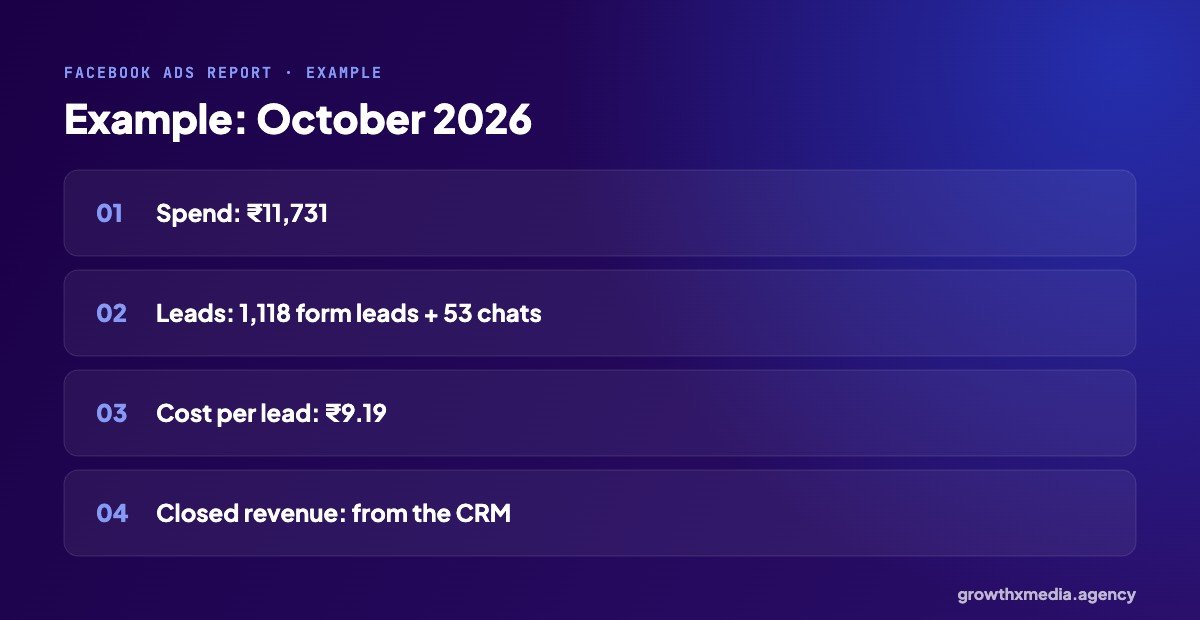
An industrial engineering company we work with, October 2026: ₹11,731 total spend, 1,118 lead-form leads at ₹9.19 each, and 53 WhatsApp chats. Closed revenue comes from the client’s own sales records, because only they know which leads bought.
What to leave out of the headline numbers
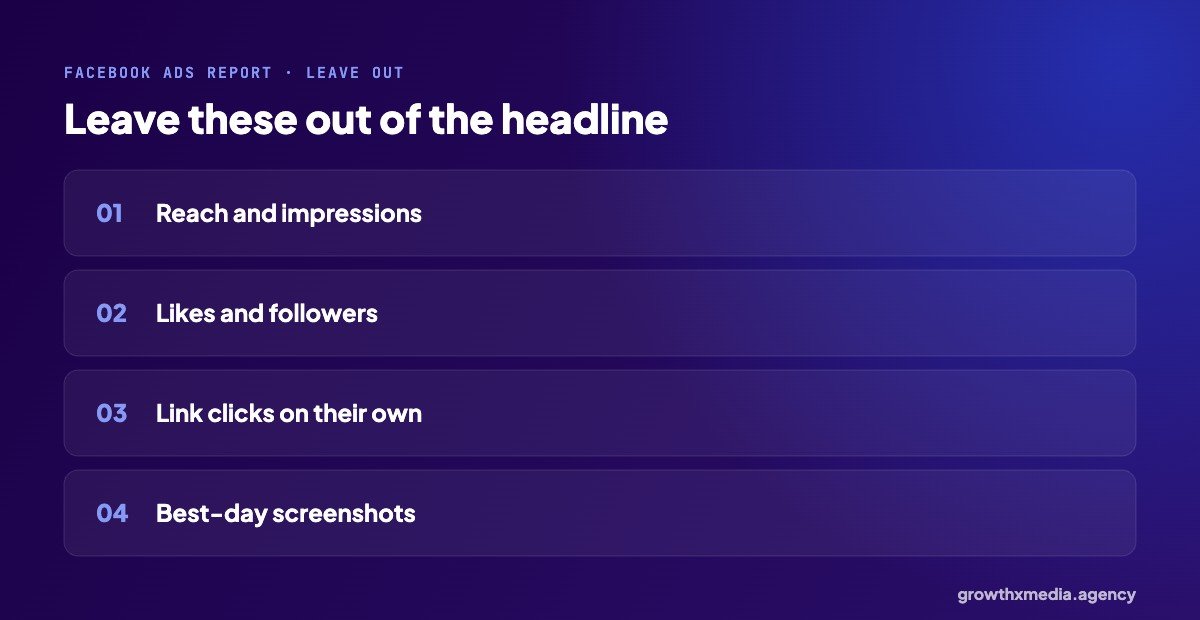
Reach, impressions, likes, followers and clicks can be useful for diagnosing problems, but they don’t pay salaries. Keep them in an appendix, not the headline. And never report a single best day as if it were the month.
The one exception is awareness campaigns, where reach is the goal. A charitable eye hospital we work with reached 2.01 crore people in a month; for that campaign, reach was the right number. See Facebook ads for hospitals.
End every Facebook ads report with actions
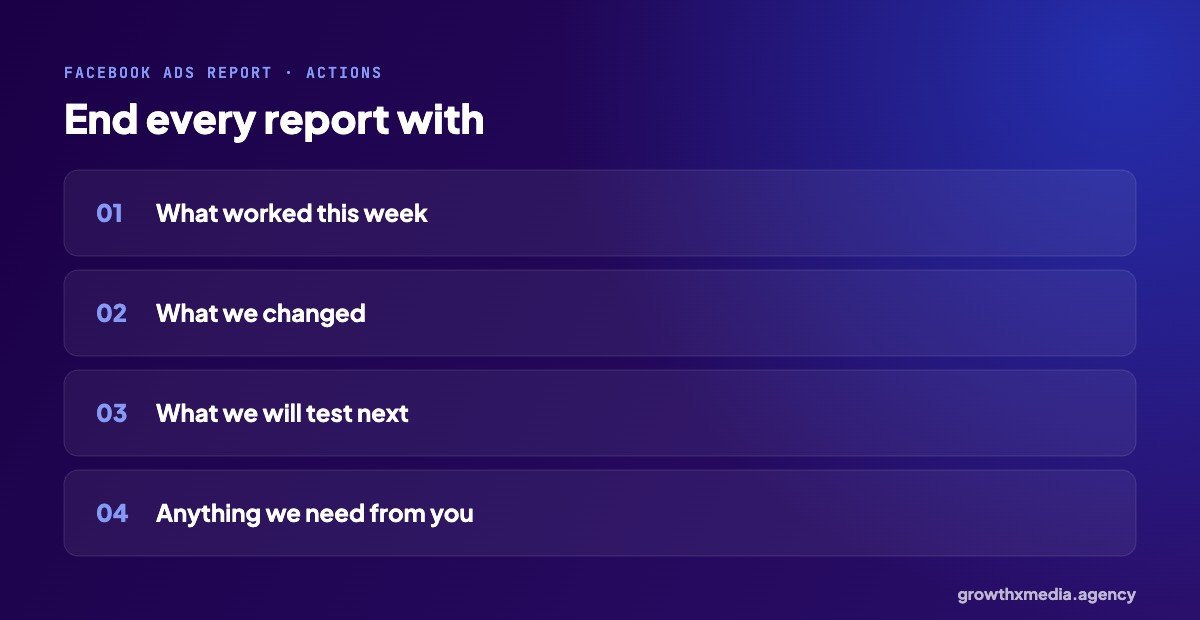
Numbers without decisions are just a scoreboard. Every report should say what worked, what we changed, what we will test next, and anything we need from the client, like new photos or faster follow-up.
How often?
Weekly for the four numbers, monthly for a longer review of strategy. Daily numbers move too much to act on, especially during the learning phase.
A simple Facebook ads report template
One page is enough. Ours follows this order:
- Headline: the four numbers for the week, with last week alongside.
- By campaign: spend, leads and cost per lead for each campaign.
- What worked: the best ad or audience this week, and why we think so.
- What we changed: budgets moved, ads paused, new tests launched.
- Next week: what we will test, and anything we need from you.
Anything else, like reach, frequency and click-through rate, goes in an appendix for anyone who wants it.
How to get closed revenue into a Facebook ads report
This is the hard part for lead businesses. The simplest way: every lead goes into a sheet or CRM with its campaign, and sales marks which ones bought and for how much. Once a week, total the revenue by campaign. Over time, connect this to Meta with the Conversions API.
Red flags in an agency’s report
- No cost per lead anywhere.
- Only percentages, no actual numbers.
- A different set of metrics every month.
- No mention of what changed or what is next.
If your current Facebook ads report has these, ask for the four numbers. Any good agency can provide them. More on choosing one in choosing a digital marketing agency.
Quick answers
Can I build a Facebook ads report in Ads Manager?
Yes. Save a custom column set with spend, results and cost per result, and export it weekly. Closed revenue has to come from your sales data.
Should agencies share Ads Manager access?
Yes. You should always be able to see your own account. Screenshots should be available on request.
Meta’s reporting tools are in Ads Manager. Want to see how your current report compares? Get a free ad account audit.
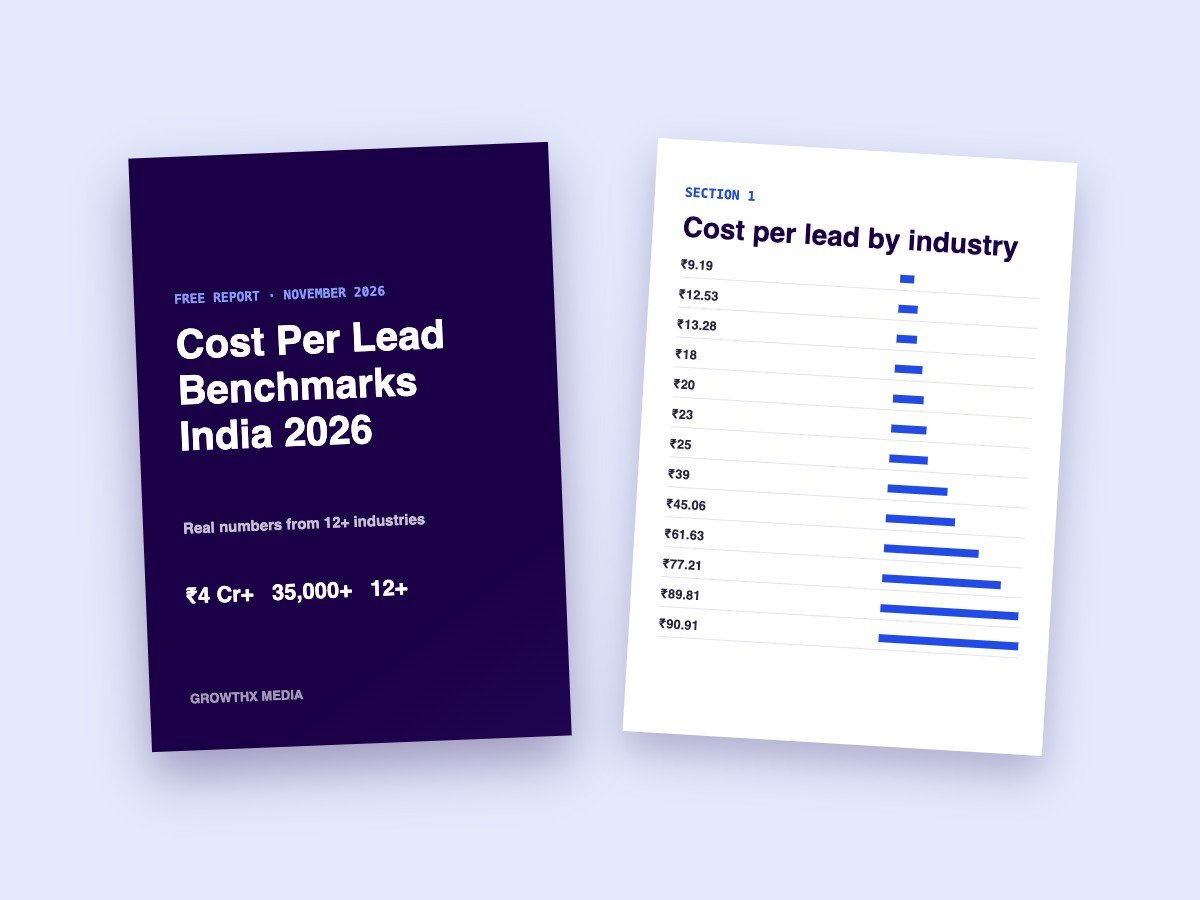
Want every benchmark in one place? Download our free cost per lead report with numbers from 13 industries.